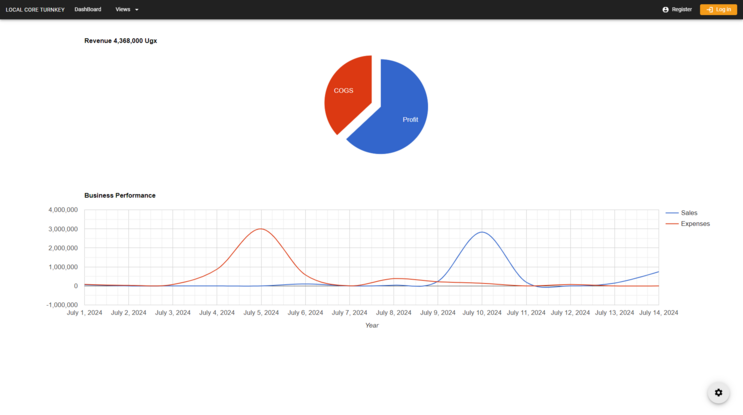
Angular components can be used to integrate Google Charts within a Turnkey Application. Load the Google Chart and its data with the Javascript module of component.
Step 1
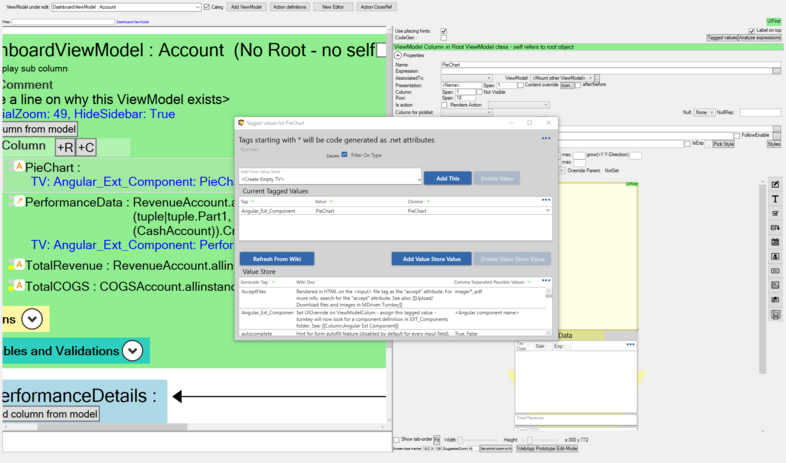
For the ViewModel that will be used for generating the graphs, Set Angular_Ext_Component tagged values on View Columns that will be used to generate graphs. These tagged values will be component names that will be created later.
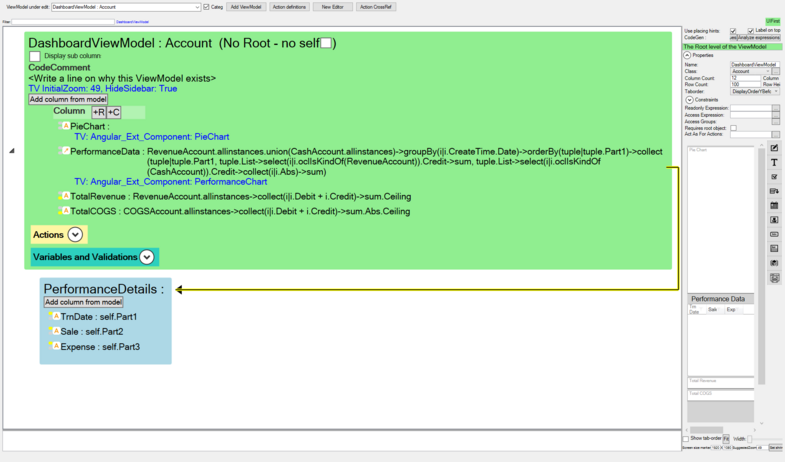
All the data to be used within the component graphs has to be available within the ViewModel.
The Visible expressions can be set to false for Columns without components but they provide data required within Charts.
Dashboard ViewModel
Step 2
Within the assets folder for the model, create components for the charts with the structure below.
Create folders with the component names set within the ViewModel columns. For this case create PerformanceChart and PieChart folders using the structure below,
\EXT_Components                          - [All components folder.]
   |
   \PerformanceChart                     - [Folder name is the name of the component.]
   |   AppWideAngularScriptIncludes.html - [Javascript libraries to be loaded by the TurnKey application and made available for the component.]
   |   PerformanceChart_module.js        - [Javascript module for PerformanceChart component to be loaded by the TurnKey application.]
   |   PerformanceChart.cshtml           - [View presentation for PerformanceChart component.]
   |
   \PieChart                             - [Folder name is the name of the component.]
       AppWideAngularScriptIncludes.html - [Javascript libraries to be loaded by the TurnKey application and made available for the component.]
       PieChart_module.js                - [Javascript module for PieChart component to be loaded by the TurnKey application.]
       PieChart.cshtml                   - [View presentation for the PieChart component.]
Content of AppWideAngularScriptIncludes.html
<!-- google charts loader -->
<script type="text/javascript" src="https://www.gstatic.com/charts/loader.js"></script>
Content of PerformanceChart.cshtml
Bind chart data to ng-model to watch for changes to data and update chart
<div performance-chart ng-model="data.PerformanceData" style="width: 100%; height: 400px" ></div>Content of PerformanceChart_module.js
function InstallDirectiveForPerformanceChart(streamingAppController) {
  streamingAppController.directive("performanceChart", function () {
    return function (scope, element, attrs) {
      // Google charts packages promise
      const chartLibrary = google.charts.load("current", { packages: ["corechart"] });

      var dataTable = []; // chart data array
      var options = {
        title: "Business Performance",
        curveType: 'function',
        hAxis: { title: "Year", titleTextStyle: { color: "#333" } },
        vAxis: { minValue: 0 },
      }; // google charts settings
      var chart;
      var data;

      // watch for changes to PerformanceData List ngModel attribute
      scope.$watchCollection(attrs.ngModel, function (value) {
        if (value) {
          dataTable = [["Year", "Sales", "Expenses"]];
          for (var i = 0; i < value.length; i++) {
            const { TrnDate, Expense, Sale } = value[i];
            dataTable.push([new Date(TrnDate), Sale, Expense]);
          }

          // (re)draw chart when there are changes to chart data
          chartLibrary.then(drawChart);
        }
      });


      function drawChart() {
        data = google.visualization.arrayToDataTable(dataTable);
        chart = new google.visualization.LineChart(element[0]);
        chart.draw(data, options);
      }
    };
  });
}
InstallDirectiveForPerformanceChart(angular.module(MDrivenAngularAppModule));
Content of PieChart.cshtml
Bind chart data to ng-model to watch for changes to data and update chart
<div pie-chart style="width: 100%; height: 400px" ng-model="data.TotalRevenue" ></div>Content of PieChart_module.js
function InstallDirectiveForPieChart(streamingAppController) {
  streamingAppController.directive("pieChart", ["$filter", function ($filter) {
    return function (scope, element, attrs) {
      // Google charts packages promise
      const chartLibrary = google.charts.load("current", { packages: ["corechart"] });

      var dataTable = []; // chart data array
      var options = {}; // google charts settings
      var chart;
      var data;

      // watch for changes to TotalRevenue value ngModel attribute
      scope.$watch(attrs.ngModel, function (value) {
        if (value) {
          const { TotalRevenue, TotalCOGS } = scope.data;
          dataTable = [
            ["Section", "Amount"],
            ["Profit", TotalRevenue - TotalCOGS],
            ["COGS", TotalCOGS],
          ];

          options = {
            title: `Revenue ${$filter('currency')(TotalRevenue, 'UGX ', 0)}`,
            legend: "none",
            pieSliceText: "label",
            slices: {
              0: { offset: 0.2 },
            },
          };
          // (re)draw chart when there are changes to chart data
          chartLibrary.then(drawChart);
        }
      });


      function drawChart() {
        data = google.visualization.arrayToDataTable(dataTable);
        chart = new google.visualization.PieChart(element[0]);
        chart.draw(data, options);
      }
    };
  }]);
}
InstallDirectiveForPieChart(angular.module(MDrivenAngularAppModule));


