Catching Debug Info and Saving it to Your Model
To further simplify debugging, we have added extended functionality in the September 2019 release.
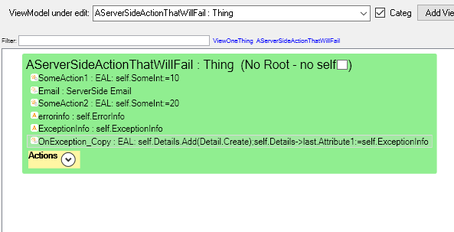
You can add root ViewModel columns named:
- ErrorInfo (not case sensitive, must start with) - string typically less than 255 char
- ExceptionInfo (not case sensitive, must start with) - string typically long with a callstack - we will truncate to fit target attribute
- OnException (action, not case sensitive, must start with)
If an exception occurs in a serverside ViewModel, we will set ErrorInfo, ExceptionInfo and lastly call OnException action.
The email action above will fail since we have not provided the needed columns for sending an email.
The action OnException is executed last - you may receive the Errorinfo and ExceptionInfo in string variables and make use of them in the OnException action.
When an exception occurs, changes done will be rolled back prior to applying the error handling described here.
It is ok to leave out some of the error-handling columns if you do not need them.
Logging and Information on What the Server Does
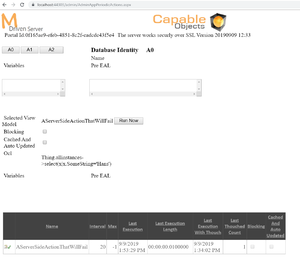
To see what actions have been executed, look them up in admin/AdminAppPeriodicActions.aspx
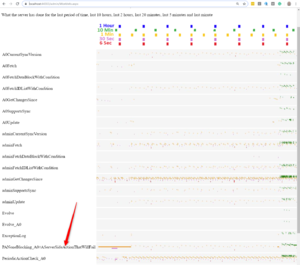
You can also get an overview of what runs when by looking at /admin/WorkInfo.aspx
The workinfo page is really good at giving an oversight of what the server does, both in the short and long term. Do not get intimidated by all the colors! Start by ignoring all the colors except bright red. The bright red refers to the running jobs - they come in from the right - far-right are the jobs happening NOW. As time passes, they move to the left. A job that starts and stops directly shows up as a dot - but as it is running for some time, a line will form. The problem with the bright red speed is that it will pass the whole timeline in one minute. This is why we have the other colors! These are the same job on another scale. The blue is the slowest - and what was a red line might show up as a blue dot due to the much lower resolution than the red, but the good thing is that it stays on the screen for a longer time. The colors between red and blue are other resolutions in between the two described.
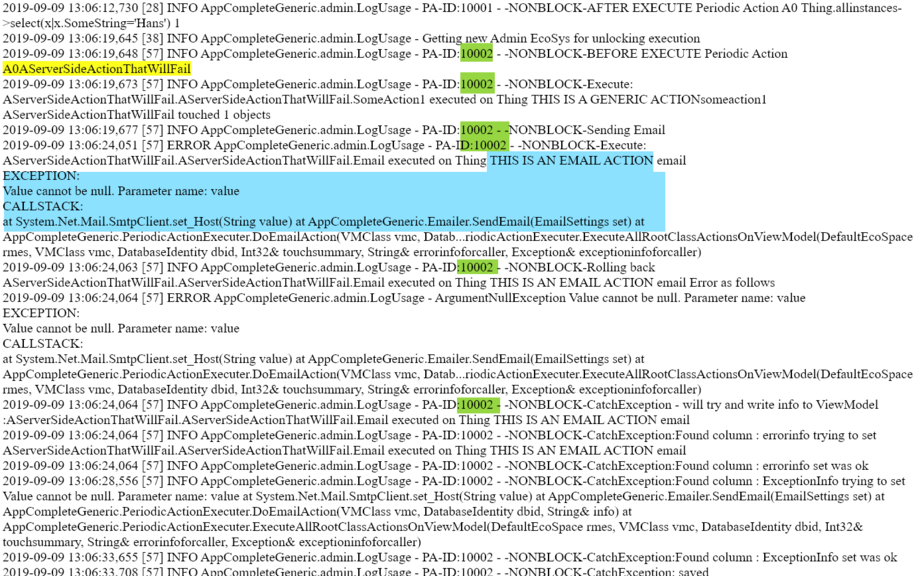
Then you will always see actions in the log at admin/Log.aspx:
Notice the number highlighted in green. This number binds one server job together. There may be many jobs going in parallel and the log will be mixed, but the number will help you see what belongs to what.
Generic Tip on How to Debug the MDrivenServer if You Have Source Code
MDrivenServer takes all its settings from a compact database found here: AppCompleteGeneric\AppCompleteGeneric.PServerIis\App_Data\DatabaseCompact.sdf
If you have a server environment that shows errors, you want to debug locally - a practical way is to get a copy of the server's DatabaseCompact.sdf and replace the DatabaseCompact.sdf you have in the development environment. This way, any connection strings or other settings that may be part of the problem you try to find are all the same in your development environment as on the server.
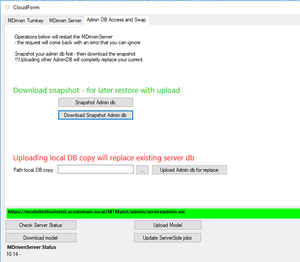
In the MDrivenDesigner Portal window, you have the option to snapshot and download the DatabaseCompact from the server - even if this can be done manually as well:
Consider stopping the server while searching for the error since 2 MDrivenServers mean 2 Client Synchronization queues - and that will confuse everyone.

